Leveraging the Power of Data: Using Power BI to Track Project Progress and KPIs
In today’s data-driven business landscape, effective project management hinges on clear visibility and actionable insights. Microsoft’s Power BI stands out as a powerful business intelligence (BI) tool, empowering organizations to transform raw data into strategic knowledge. However, project managers often face challenges in tracking progress and key performance indicators (KPIs). In this blog, we explore how Power BI can bridge this gap, providing real-time data visualizations to enhance project control and decision-making.
Power BI for project management enables you to integrate seamlessly with various project management tools, enabling you to leverage existing data sources. The benefits of using Power BI for project management are numerous:
- Improved Visibility: Gain a comprehensive view of project progress, milestones achieved, and potential roadblocks.
- Effortless KPI Tracking: Monitor and analyze critical performance indicators, ensuring projects stay on track.
- Enhanced Decision-Making: Leverage data-driven insights to make informed decisions about resource allocation, risk mitigation, and project scope adjustments.

- Increased Transparency and Communication: Foster collaboration by sharing interactive dashboards and reports with stakeholders.
To track your progress with Power BI is pretty straightforward. Just to connect it to allow you to import data from spreadsheets, project management software, or cloud-based platforms. Power BI offers a vast array of data visualization techniques to effectively track progress. It can create dynamic dashboards displaying essential project metrics like task completion rates, budget expenditure, and resource utilization. It helps visualize project schedules, dependencies, and critical paths with Gantt charts for clear progress monitoring. It can help in tracking remaining work and identify potential schedule deviations using burn down charts and it can develop custom metrics to gauge overall project health, encompassing factors like team morale and risk exposure. By leveraging these visualizations, project managers can proactively identify and address issues, ensuring projects stay on schedule and within budget.
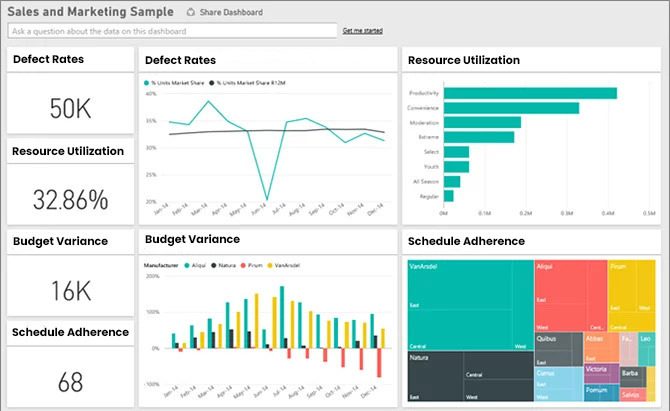
Effectively utilizing the power of Power BI is also knowing the right KPIs to track. In project management, this includes
- Schedule Adherence: Track the percentage of tasks completed on time.
- Budget Variance: Monitor deviations between actual and planned project costs.
- Resource Utilization: Analyze team member workload and identify potential bottlenecks.

- Defect Rates: Measure the number of errors encountered to ensure quality control.
Power BI empowers you to create impactful KPI visualizations by presenting key metrics in a concise and visually appealing format, enabling at-a-glance performance evaluation. Identifying emerging trends and predicting potential issues by analyzing historical data and projected outcomes. Most importantly, it gives you a deep dive into deviations from project baselines to understand root causes and implement corrective actions.
Real-time data insights from Power BI empower project managers to make informed decisions throughout the project lifecycle, leading to improved project success rates Power BI offers valuable collaboration features for real-time stakeholder communication and drill-down capabilities for deeper analysis. If you’re looking to elevate your project management practices and embrace data-driven decision-making, we encourage you to explore the transformative potential of Power BI.